Django Metrics, Logs & Traces Observability with Opentelemetry and Grafana
Metrics, Logs and Traces (MLT) are the three pillars of observability that can provide us with complete visibility of a software system. In this article, we’re going to set up a system where MLT data is collected from a hello-world microservice application.
Contents
- What are metrics, logs and traces?
- How can we collect metrics, logs and traces?
- Project background
- Step by step implementation
- Demo
- Conclusion
1. What are metrics, logs and traces (MLT)?
Metrics
Metrics show the measure of how a system resource is used. They are typically numerical. For example-
- How much CPU was used in the past hour?
- How much disk space is consumed?
- How much bandwidth has been used?
Logs
Logs are events that a running software records. For example-
- Log the stack trace of a runtime error
- Log when a user accesses the system
- Log a critical error
Traces
Traces show the path of a program’s execution. In a microservice/distributed system, a request from a client may get processed through several services. It is important to know through which path a request has been processed and how much processing time was needed in each node so that errors and bottlenecks can be identified.
More about MLT
It’s not necessary that all three of MLT must be collected. Logs are the most important element to collect as they convey what errors have occurred and how the software executes.
Metrics are the next most important element to collect. With metrics, we can know how well the software is performing and whether we need to optimize functions or scale up servers.
Finally, with tracing, we can track in what sequence a request has been processed. This was unnecessary previously because most systems were monoliths and did not require tracing. But as microservices and distributed systems are getting more popular, it is increasingly becoming important to track how requests go through each service in the system.
Thus we should get complete observability of a system by collecting metrics, logs and traces. In addition to that, we should be able to correlate MLT easily to better understand the system. For example, from a log we should also be able to go to its trace from where it was formed and vice-versa. By the end of this article, we should be able to see this implementation.
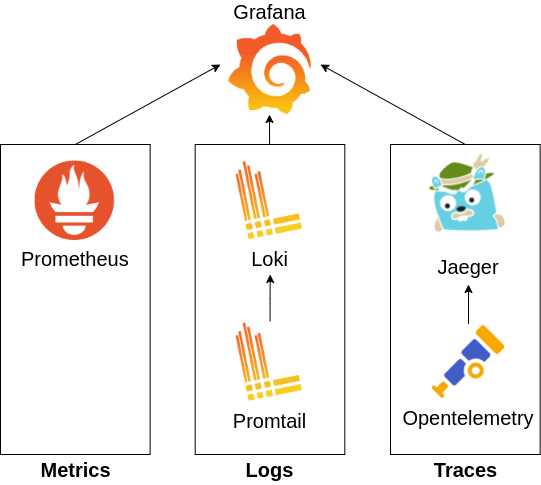
2. How can we collect metrics, logs and traces?
The following tools can be used to collect MLT data. There are of course other alternatives. But for this tutorial, We will use the tools below.
- Grafana [Dashboard]: This is a dashboard where we will observe the MLT data collected by the rest of the services.
- Prometheus [Monitoring]: Collects and stores metrics from applications.
- Promtail [Logging]: Collects log data from applications and sends them to Loki.
- Loki [Logging]: Aggregates and stores all logs sent by Promtail.
- Opentelemetry [Tracing]: Instruments an app to collect traces and sends them to Jaeger.
- Jaeger [Tracing]: Collects and stores tracing information. Also helps in trace visualization.
The following figure summarizes the technology dependencies.

3. Project Background
3.1 Prerequisites
Before we get to the implementation, there are a few things that you should be acquainted with before moving forward.
- Docker: You should be familiar with docker. The example project relies heavily on Dockerfiles and docker-compose files.
- Python/Django: You should be familiar with python. Knowing Django isn’t necessary but understanding it will help understand the hello-world microservices in the example project.
3.2 Source code
The complete implementation of this article can be found at github.com/rafed/opentelemetry-python-grafana-mlt. Clone the project using
$ git clone https://github.com/rafed/opentelemetry-python-grafana-mlt
Explore the project structure of the repository to get a general idea of what exists where.
3.3 Services and System Architecture
The project has two django apps- a webapp and a webapi. They have the following endpoints.
- Webapp
- /
- /service
- Webapi
- /
- /add
The system architecture is simple. A user hits Webapp at localhost:8000/service. The webapp subsequently hits webapi at localhost:8001/add to calculate the value of 2+2.
localhost:8000]-->B[webapi
localhost:8001];
The root endpoints are provided so that we can check whether the services are running or not.
4. Step by step implementation
If you have a django project you can add the monitors by following the steps below. Or you can use the django projects in the repository provided with this tutorial.
4.1 Add/run the services in docker-compose
To run our implementation we will make use of docker-compose as it will make redeploying our iterations easier. Add services to a docker-compose.yaml file.
services:
  webapp:
    build: ./webapp
    command: python manage.py runserver 0.0.0.0:8000
    volumes:
      - ./webapp:/webapp
    ports:
      - "8000:8000"
    depends_on:
      - webapi

  webapi:
    build: ./webapi
    command: python manage.py runserver 0.0.0.0:8001
    volumes:
      - ./webapi:/webapi
    ports:
      - "8001:8001"
Run the services using
$ docker-compose up
4.2 Install Prometheus (for metrics)
To collect metrics from django we need to install a metrics collector and exporter for django.
In your django requirements.txt add the following.
django-prometheus==2.2.0
In settings.py add in INSTALLED_APPS
INSTALLED_APPS = [
    ...
    'django_prometheus',
]
and in MIDDLEWARE
MIDDLEWARE = [
    'django_prometheus.middleware.PrometheusBeforeMiddleware',
    ... Other
    ... middlewares
    ... in the middle
    'django_prometheus.middleware.PrometheusAfterMiddleware',
]
In urls.py add
urlpatterns = [
    ...
    path('', include('django_prometheus.urls')),
]
Now, when the django apps run, they will export the django metrics in /metrics endpoint.
Next we need to run prometheus to collect metrics from these endpoints exported from django. Create file a file prometheus/prometheus.yaml and add the following code.
global:
  scrape_interval: 10s
  scrape_timeout: 5s

scrape_configs:
  - job_name: prometheus
    metrics_path: /metrics
    static_configs:
      - targets:
          - 'prometheus:9090'

  - job_name: webapp-scraper
    metrics_path: /metrics
    static_configs:
      - targets:
          - 'webapp:8000'
        labels:
          app: webapp

  - job_name: webapi-scraper
    metrics_path: /metrics
    static_configs:
      - targets:
          - 'webapi:8001'
        labels:
          app: webapi
This config tells prometheus that our app should be scraped at a 10 seconds interval. There are three jobs that define from what endpoints metrics should be collected. Notice that we are adding labels to the logs so that we can later filter search results with this label.
Finally add prometheus to the docker-compose.yaml file.
services:
    prometheus:
        image: prom/prometheus:v2.35.0
        ports:
            - 9090:9090
        volumes:
            - ./prometheus:/etc/prometheus
        command: --config.file=/etc/prometheus/prometheus.yaml
Prometheus will now collect and export metrics from our django apps. Skip to section 4.5 to install grafana and check whether the metrics configuration is working or not.
4.3 Install Loki and Promtail (for logs)
At first we need to make sure that our django apps are writing logs.
In your django requirements.txt make sure to have the following and install them.
opentelemetry-sdk==1.10.0
opentelemetry-api==1.10.0
opentelemetry-instrumentation==0.29b0
opentelemetry-instrumentation-django==0.29b0
opentelemetry-instrumentation-logging==0.29b0
In settings.py add a LOGGING configuration. I use the following.
LOGGING = {
    'version': 1,
    'disable_existing_loggers': False,
    'formatters': {
        'trace_formatter': {
            'format': '[%(asctime)s] %(levelname)s [%(name)s:%(lineno)s] [trace_id=%(otelTraceID)s span_id=%(otelSpanID)s] [%(funcName)s] %(message)s',  # optional, default is logging.BASIC_FORMAT
            'datefmt': '%Y-%m-%d %H:%M:%S',  # optional, default is '%Y-%m-%d %H:%M:%S'
        },
    },
    'handlers': {
        'file': {
            'level': 'WARNING',
            'class': 'logging.FileHandler',
            'formatter': 'trace_formatter',
            'filename': 'webapp.log',
        },
        'console': {
            'class': 'logging.StreamHandler',
            'formatter': 'trace_formatter',
        },
    },
    'loggers': {
        'django': {
            'handlers': ['console'],
            'level': 'INFO',
            'propagate': True,
        },
    },
    'root': {
        'handlers': ['console', 'file'],
        'level': 'WARNING',
    },
}
Ignore the trace_formatter for now. We will need it in the next section for logging trace ids.
Make sure your django views are writing some sort of logs. You can use the following template for recording logs.
import logging

logger = logging.getLogger(__name__)

logger.error("Log1 on Webapp!")
After confirming that some sort of logs are being written on a file you can continue installing promtail.
Create a file promtail/promtail.yaml and put the following config.
server:
  http_listen_port: 9080
  grpc_listen_port: 0

positions:
  filename: /tmp/positions.yaml

clients:
  - url: http://loki:3100/loki/api/v1/push

scrape_configs:
- job_name: django-log-scraper
  static_configs:
  - targets:
      - localhost
    labels:
      __path__: "/var/log/webapp.log"
      app: webapp
  - targets:
      - localhost
    labels:
      __path__: "/var/log/webapi.log"
      app: webapi
This config tells promtail to collect logs from /var/log/webapp.log and /var/log/webapi.log in the promtail container and send them to a loki endpoint. But how does promtail get these logs in its own container? We mount the django logs in the promtail container using docker-compose.
In the docker-compose add the following config.
services:
    promtail:
        image: grafana/promtail:2.5.0
        volumes:
        - ./promtail/promtail.yaml:/etc/promtail/promtail.yaml
        - ./webapp/webapp.log:/var/log/webapp.log
        - ./webapi/webapi.log:/var/log/webapi.log
        command: --config.file=/etc/promtail/promtail.yaml
        depends_on:
        - webapp
        - webapi

    loki:
        image: grafana/loki:2.5.0
        ports:
        - "3100:3100"
        depends_on:
        - promtail
Here we are binding the django log files to the container of promtail at /var/log/, so that they can be read by promtail.
Voila! The log configuration should now be working properly. Skip to section 4.5 to install grafana and check whether the log configuration is working or not.
4.4 Install Jaeger (for tracing)
For tracing to work make sure you have the following dependencies installed.
opentelemetry-sdk==1.10.0
opentelemetry-api==1.10.0
opentelemetry-exporter-jaeger==1.10.0
opentelemetry-instrumentation==0.29b0
opentelemetry-instrumentation-django==0.29b0
opentelemetry-instrumentation-logging==0.29b0
opentelemetry-instrumentation-requests==0.29b0
requests==2.27.1
We wil use the requests library to call APIs from the webapi service. By adding opentelemetry-instrumentation-requests package, calls made by requests library will automatically be injected with tokens required to trace requests.
Now go to manage.py and add the following.
    DjangoInstrumentor().instrument()
    LoggingInstrumentor().instrument()
    RequestsInstrumentor().instrument()

    jaeger_exporter = JaegerExporter(
        agent_host_name=os.getenv("TRACING_HOST"),
        agent_port= int(os.getenv("TRACING_PORT")),
    )
    trace.set_tracer_provider(TracerProvider(
        resource=Resource.create({SERVICE_NAME: 'webapp'})
    ))
    span_processor = BatchSpanProcessor(jaeger_exporter)
    trace.get_tracer_provider().add_span_processor(span_processor)
The collected traces will be exported to the url TRACING_HOST:TRACING_PORT. But from where are the values coming? It can be set using docker-compose. Modify docker-compose to something like this.
webapp:
    build: ./webapp
    command: python manage.py runserver 0.0.0.0:8000
    environment:
      - TRACING_HOST=jaeger
      - TRACING_PORT=6831
    ...

  webapi:
    build: ./webapi
    command: python manage.py runserver 0.0.0.0:8001
    environment:
      - TRACING_HOST=jaeger
      - TRACING_PORT=6831
    ...
Now that the environment variables are set up let’s set up the host that will collect the traces. We will use Jaeger for this.
In the docker-compose add configuration for jaeger.
services:
  jaeger:
    image: jaegertracing/all-in-one:1.32
    ports:
      - 16686:16686
      - 6831:6831
Now run all the containers in docker-compose. When requests are made, the traces should be collected and stored in jaeger. Check if the traces are being collected properly by visiting localhost:16686. Or optionally set up grafana in section 4.5 to view them from grafana.
By default we don’t need any extra code in our application to trace requests. However, if we need to know the execution time of a subpart of our trace we can add snippets like the following.
from opentelemetry import trace

tracer = trace.get_tracer(__name__)

def service(request):
    with tracer.start_as_current_span("Heavy task") as span:
        ### A compute heavy task
        ...

    return render(request, 'app/service.html', context)
If you remember, in the previous section we added a config in the LOGGER in settings.py which was something like this.
'formatters': {
    'trace_formatter': {
        'format': '[%(asctime)s] %(levelname)s [%(name)s:%(lineno)s] [trace_id=%(otelTraceID)s span_id=%(otelSpanID)s] [%(funcName)s] %(message)s',  # optional, default is logging.BASIC_FORMAT
        'datefmt': '%Y-%m-%d %H:%M:%S',  # optional, default is '%Y-%m-%d %H:%M:%S'
    },
},
This formatter adds tracing information to the logs so that we can jump to traces right from our logs. How it’s gonna work, we’re going to look at it in the next section.
4.5 Install Grafana for monitoring
Now that we are collecting everything, it’s finally time to visualize them. We will use Grafana as our central observability system for everything.
First, make a file grafana/dashboard.yaml and put in the content below.
apiVersion: 1   # Dont remove this or you'll suffer

datasources:
  - name: prometheus
    type: prometheus
    uid: my-prometheus
    access: browser
    url: http://prometheus:9090
    isDefault: false
    version: 1
    editable: true
    basicAuth: false

  - name: loki
    type: loki
    uid: my-loki
    access: server
    orgId: 1
    url: http://loki:3100
    basicAuth: false
    isDefault: false
    version: 1
    editable: true
    jsonData:
      derivedFields:
        - datasourceUid: my-jaeger
          name: TraceID
          matcherRegex: trace_id=(\w+)
          url: '$${__value.raw}'
        - name: TraceID
          matcherRegex: trace_id=(\w+)
          url: 'http://localhost:16686/trace/$${__value.raw}'

  - name: jaeger
    type: jaeger
    uid: my-jaeger
    access: browser
    url: http://jaeger:16686
    isDefault: false
    version: 1
    editable: true
    basicAuth: false
    jsonData:
      httpMethod: GET
      tracesToLogs:
        datasourceUid: my-loki
        tags: []
        mappedTags: [{ key: 'service.name', value: 'app' }]
        mapTagNamesEnabled: true
This config defines the datasources grafana should pull data from. Since we made three data sources in the previous sections for metrics, logs and traces, this config also has three entries corresponding to each of them.
The jsondata config in loki defines how to jump to traces from the viewed logs. And jsondata config in jaeger defines how to jump to logs from the viewed traces.
Now lets add grafana to our list of services in the docker-compose file.
services:
  grafana:
    image: grafana/grafana:8.5.2
    ports:
      - "3000:3000"
    volumes:
      - ./grafana/dashboard.yaml:/etc/grafana/provisioning/datasources/dashboard.yaml
    depends_on:
      - loki
      - prometheus
      - jaeger
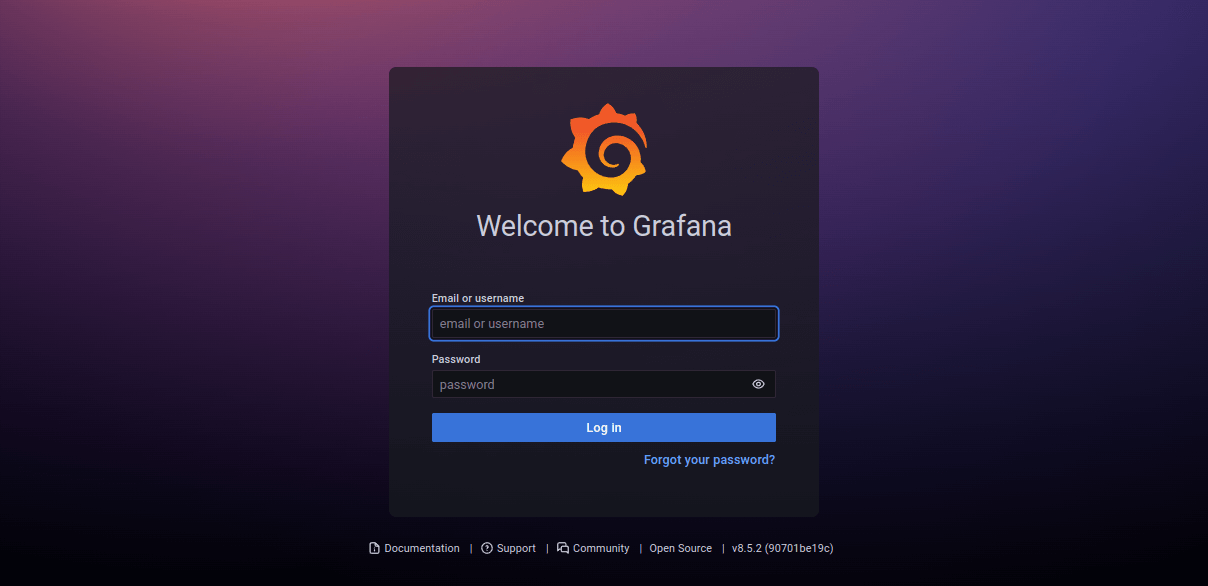
Run docker compose and then the grafana dashboard should be up and running. Go to localhost:3000 to check if it is running.
Let’s now see the demo of how everything should work!
5. Demo
If you have followed the tutorial so far, kudos to you! Run your docker-compose file to spin up all ther services. If you haven’t then clone the example repo and run it by following the steps below.
# 1. Clone the repo
$ git clone https://github.com/rafed/opentelemetry-python-grafana-mlt

# 2. Go inside the repo
$ cd opentelemetry-python-grafana-mlt

# 3. Run the apps and services (Docker should be installed)
$ docker-compose up
Now go to localhost:3000 where the Grafana admin panel is served. Login using username:admin and password:admin.
To generate metrics, logs and traces make sure that you load the app several times (localhost:8000/service).
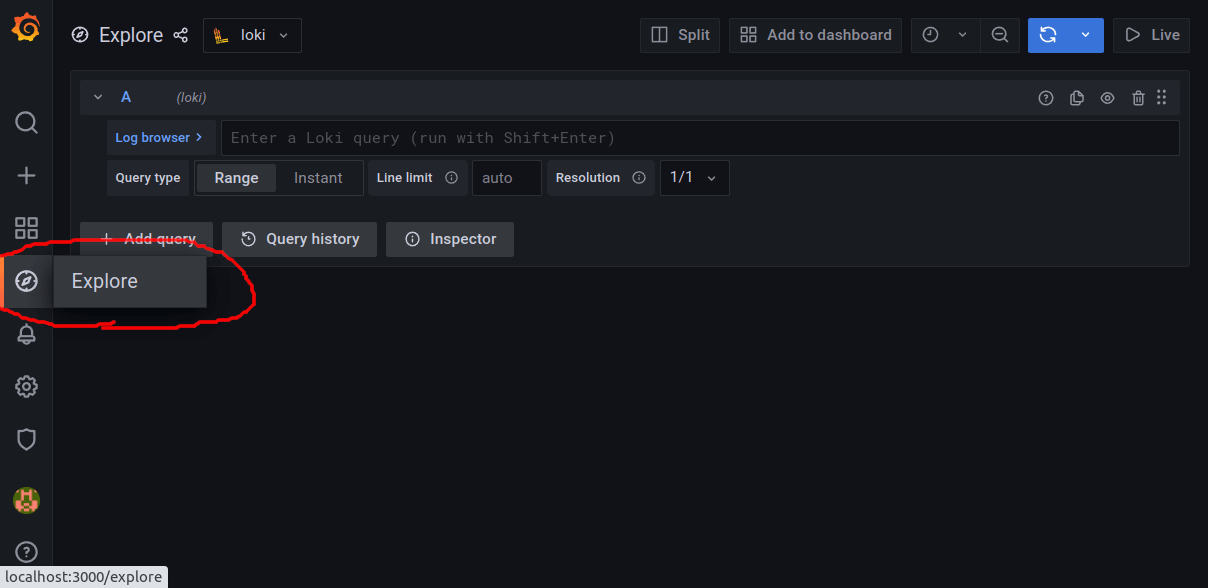
Then, go to explore on the left side panel. On the top of the explore page, you’ll find datasources loki, jaeger and prometheus. You can select each to explore logs, traces and metrics respectively emitted from the webapp and webapi.
To view logs, select Loki as a datasource first. Select a log source by label from the Log browser and view logs. You should see something like this.
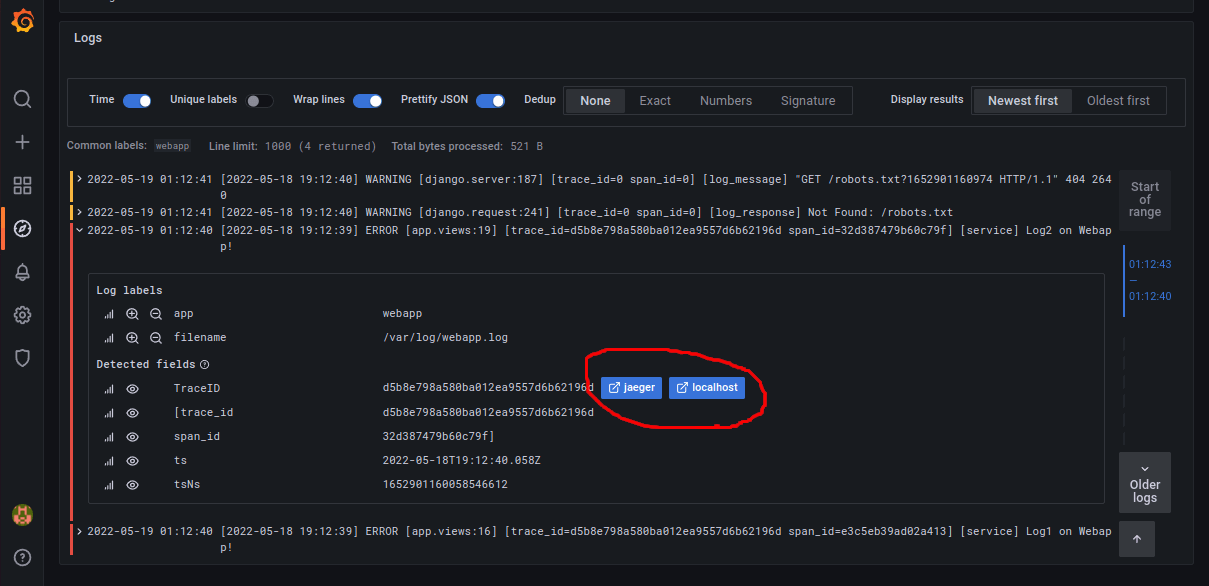
From these logs you can jump to their traces as well (click red marked area).
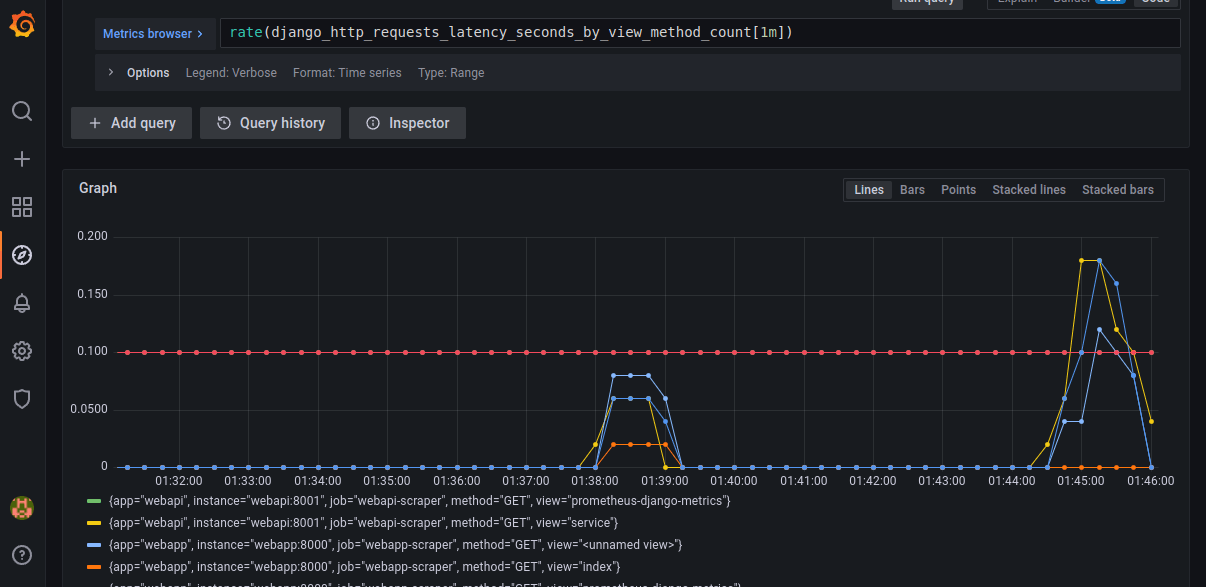
To view metrics, select Prometheus as a datasource. Make a query (e.g. rate(django_http_requests_latency_seconds_by_view_method_count[1m])) and you should see something like this.
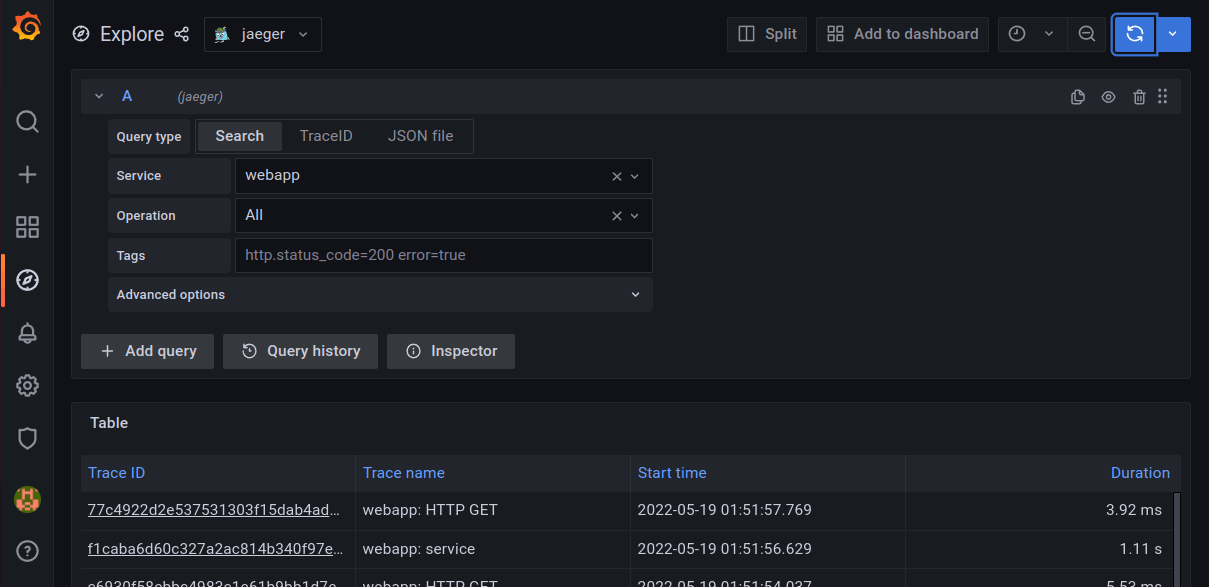
Finally, to view traces, select Jaeger as a data source. Choose a service and run query. You should see many traces like the following.
When you click a trace_id, the screen will be split to show the actual traces.
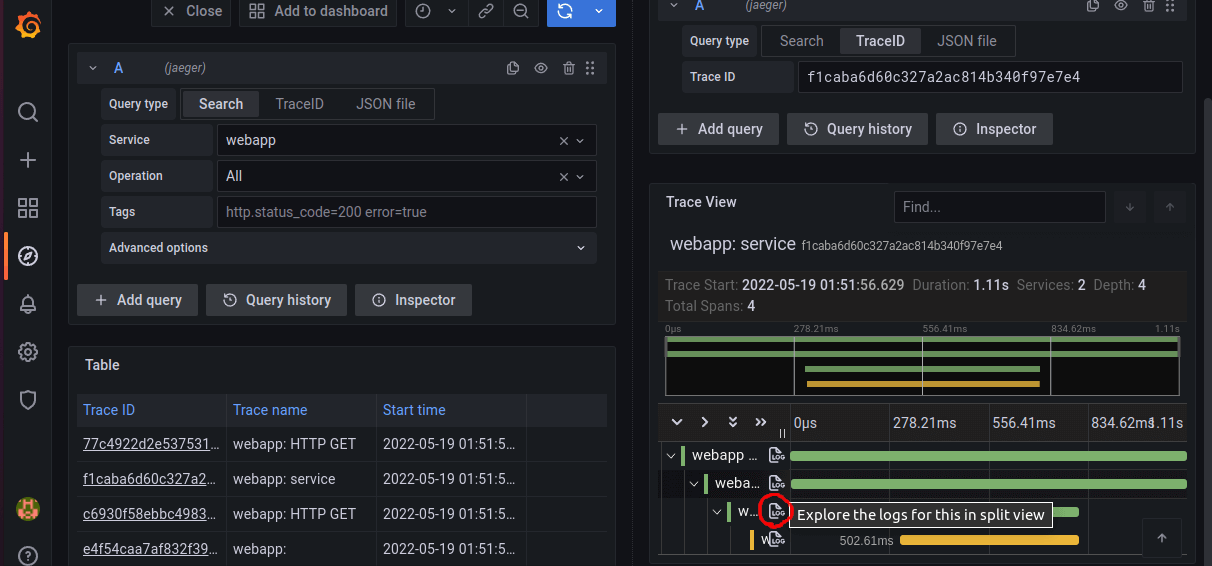
You can also jump to logs from traces by clicking on the red marked area. Isn’t this awesome?
Conclusion
MLT observability is now a necessity for distributed systems. But to actually implement it can be hard. I hope that this article can be of help to anyone who wants to achieve observability in their systems using open source technologies such as Grafana, Opentelemetry, Loki, Prometheus and Jaeger. If you find any problems with this article feel free to comment below. You can also contact me through my email if you face any issues.
References
- opentelemetry-python.readthedocs.io/
- grafana.com/oss/loki/
- https://prometheus.io/docs/visualization/grafana/
- jaegertracing.io/docs/1.34/getting-started/
Sharing is caring!